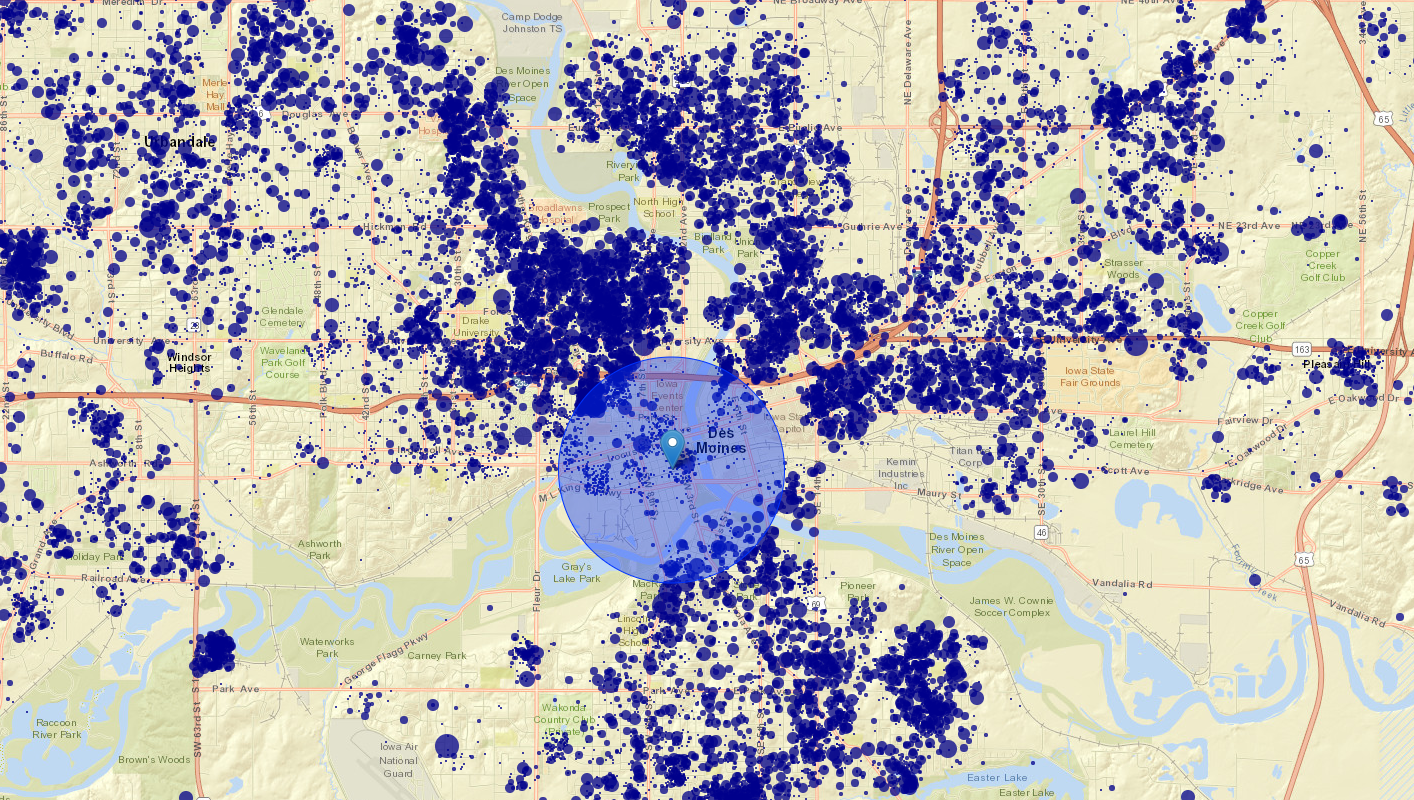
DMARC Food Pantry usage tracked within a 1-mile radius of Business Publications Corp. on Fourth Street, parent company of the Des Moines Business Record and dsm Magazine. DMARC serves 1,681 unique individuals who report addresses in proximity of BPC. The blue dots across the map mark individual households that relied on DMARC Food Pantry services in 2019.
Map provided by DMARC
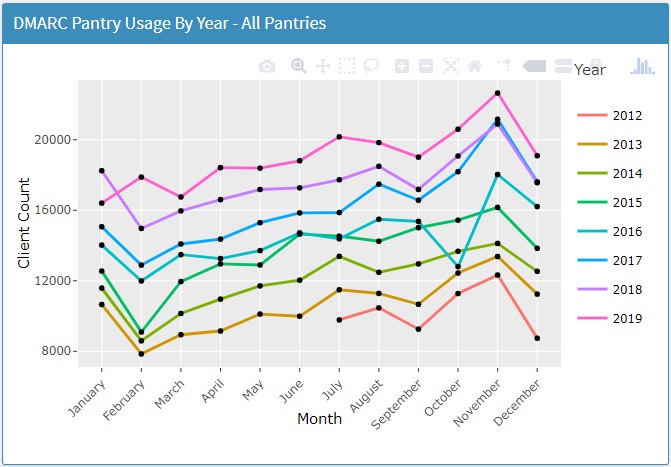
The Des Moines Area Religious Council may be most known for its Food Pantry Network, and this year the food pantry saw a stark jump. DMARC had its busiest month of all time in November, when it served nearly 23,000 unique individuals in its food pantry network, capping off a steady rise in pantry use since 2012. Through the DMARC Data Dashboard, staff members watched the rise in real time.
“It has just been going up and up and up. We keep hoping we’re going to see some kind of plateau in total services, sort of like a natural ceiling in how many individuals we can actually serve in a given calendar month. Thus far, we just haven’t had it,” said Daniel Beck, DMARC data analyst.

After development led by Beck and DMARC volunteer Tom Fischer, DMARC’s Data Dashboard has been tracking client visits to 14 food pantries and 30 mobile food pantry locations per month across the metro since 2012.
Between 100 and 150 DMARC staff members and volunteers are trained in the intake system, which registers as much information about new clients’ addresses, employment status, food assistance status and demographics as the client provides — although DMARC will not ask about immigration or citizenship status to avoid scaring clients who would otherwise use pantry services.
About 1% of the individuals served don’t provide a home address and aren’t reflected in the visualization maps the DMARC Dashboard generates. (The blue dots representing households on the visualization map are staggered up to 200 meters off of a client’s true address for confidentiality.) Thirty-six percent of the individuals DMARC served in 2019 were under age 18.
“One of the reasons why this data visualization dashboard is so impactful is that it’s trying to tear down those stereotypes. A lot of people would say, ‘Well, most people who are hungry, they must be homeless,’” said Leslie Garman, director of development and outreach at DMARC. “That’s absolutely not the truth, and this is one of the tools that we can use to show them.”
Given a reporter’s home address in Des Moines during a demonstration, Beck searched the database for a three-mile radius and found 6,500 individuals are relying on DMARC’s pantry network; about 35% of those individuals are under 18.
The dashboard can overlay DMARC’s data over maps of school districts, ZIP codes or Senate boundaries, which gives the organization the ability to show local school or government representatives a visualization of how many students and constituents struggle with food insecurity.
“People want the stories too, but the data is really powerful, especially with legislators. As people are proposing legislative changes to anything around the sphere of food insecurity and poverty, we can show them impacts that we think it will have,” said Matt Unger, chief executive officer of DMARC.
DMARC’s grasp of the data gives the organization a stronger visualization of what happens when outside factors influence the food pantry’s service: In January 2019 DMARC saw service rates drop as SNAP benefit recipients received two months’ of SNAP funds at once just before the federal government shut down for 35 days, the longest U.S. government shutdown in history. Service then spiked dramatically in February, which traditionally is a slower month for DMARC’s pantries.
“To be able to show exactly what happens when something changes with benefits … so often the response is, ‘Well, the nonprofit community will pick this up, they’ve got it taken care of,’” Unger said. “We try to have as many different ways to tell our story as we can, and this is a fairly powerful one that is pretty unique to us. There’s not a lot of pantries that are out there collecting this level of data.”
DMARC is looking to partner with other organizations in Central Iowa as a way to add context to the dashboard. Currently, the organization partners with independent, data-affiliated pantries in the region, allowing partners in Dallas and Warren counties to use DMARC’s intake system when registering clients. In turn, DMARC is able to layer partner data over its map — bumping unique visitors served to 25,000 unique individuals in November.
Privacy for DMARC’s clients has kept the organization from releasing a publicly viewable and searchable interface. For now, DMARC representatives continue to meet with local groups and policy leaders to share the impact DMARC’s pantry network has on citizens.
“We’re on a mission to get other nonprofts working together, especially those that are collecting data in a similar way to see where can we layer this, where we’re serving the same people and where maybe we could come up with better interventions,” Unger said.
